Genzyme sent a letter about short supply
Genzyme Sanofi company with it;s main orphan drug, sent
again a letter about its short supply of Cerezyme that used as a drug to treat the Gauche patients again.
In a
letter to health care providers
sent on Sep 13, 2011, Genzyme said adult patients would probably receive only
one dose a month instead of the usual two, from October through January.
- We would like to provide an update regarding our expectations for supply of Cerezyme in the U.S. A temporary decrease in Cerezyme yields, combined with changes to our product release processes and procedures that lengthen the overall time it takes to release Cerezyme require us to change our supply projections for the next four months starting October, 2011.
Changes to Cerezyme availability will be felt globally. Delays in shipments will likely affect patients and some adjustment to individual treatment plans may be necessary.
The drug which costs around $250,000 a year, treats Gaucher disease, a
rare inherited enzyme deficiency.
In June 2009 Genzyme was forced
to temporarily close its Boston's factory, because of viral contamination. It did not restore full
supplies of Cerezyme until January of this year, much later than it
initially expected.
The main competitor for the Gauche drug supply is Shire’s Vpriv that approved by the FDA last year but they are limited with a supply to 1000 patients, while there is 5500 patients in the world that treated with Gauche drugs from Genzyme, Shire, and rest with Protlaix (PLX) drug Uplyso
taliglucerase alfa that still waiting for the FDA approval .
I think that this shortage will encourage the FDA to approve PLX, as this orphan drug need more supply to rely on as this decease is a life threatening, and the FDA knows that those shortage with Cerezyme might be for a longer periods.
- One possible beneficiary is Protalix BioTherapeutics, according to Wells
Fargo Securities analyst Brian Abrahams. In an investor note, he writes
that with the Cerezyme shortage “shortage occurring in the months ahead
of the February PDUFA date for PLX taliglucerase,
this should highlight to the FDA the need for an additional enzyme
supplier and perhaps increase the likelihood of approval.”
Many believed that Taliglucerase Alfa had a shot on obtaining
FDA approval (one prime example was Oppenheimer’s equity research on
PLX), but on February 25, 2011, the FDA issued a Complete Response Letter (CRL)
regarding the company’s NDA for Taliglucerase Alfa. A CRL is issued by
the FDA's Center for Drug Evaluation and Research when the review of a
file is completed and questions remain that precludes the approval of
the NDA in its current form. The main questions raised by the FDA
regarding the NDA related to the clinical and CMC sections. In
the clinical section of the CRL, the FDA requested additional data from
the ongoing switchover trial and the long-term extension trial. At the
time the NDA was submitted, full data from these trials were not
available. In the CMC section of the CRL, the FDA requested information regarding testing specifications and assay validation. The FDA did
not however request additional clinical studies in the CRL.
One thing to note is that the marketing applications filed in the European Union, Brazil and Australia
include certain data now being requested by the FDA in the CRL .
These applications (the marketing applications) were submitted
after filing the NDA, during which Protalix had collected additional data from these ongoing trials.
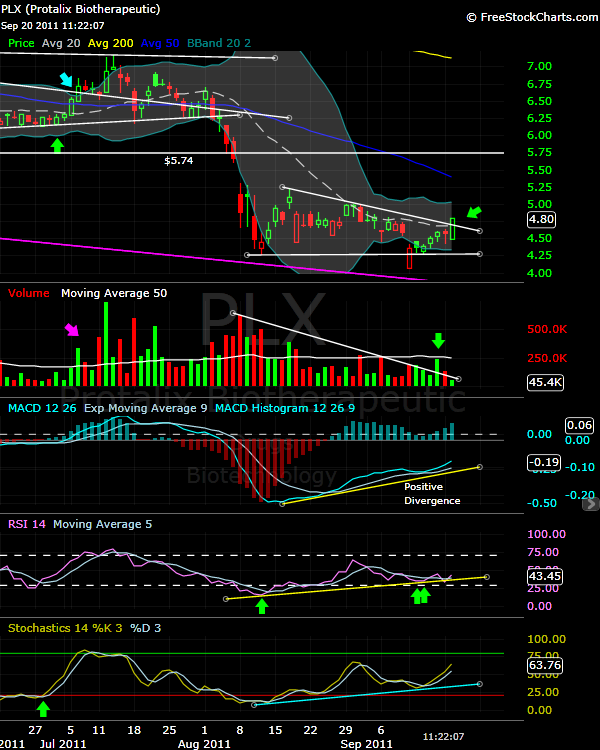
Form the Technical side, we can see that $PLX is trading in a "Positive Divergence" in the past few weeks, as the price drop but the momentum is gaining all the time, just looking @ the MACD & RSI we can see the positive divergence very clear, and the volume is decreasing in the down days...that's show a price consolidation that will lead for a new uptrend in the near future
Don't forget that beside the main catalyst of the FDA approval as the PDUFA date on Feb 01, 2012...but meanwhile, $PLX have 2 other important catalyst set for Q4, the EU & Brazilian approval for Taligluceraee Alfa that could take the price for a new run-up even before the FDA approval.
Look at the channel breakup for a new trend, the price should breakup the 20MA too then the 50MA waiting around the $5.40 point as a resistance too...
Disclosure: Long $PLX
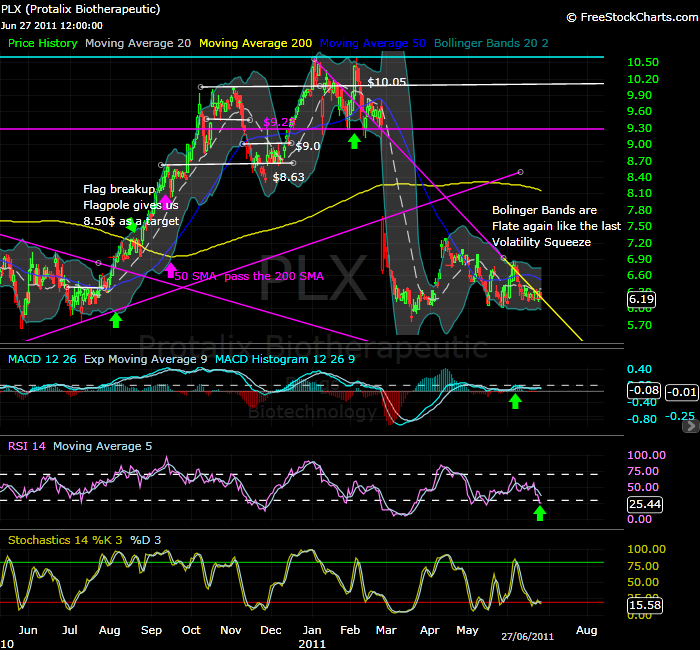
Daily Chart


